Add insight and visual appeal to your data
Infographics are a visual representation of data, and an effective tool to present key information to an audience in a clear and concise way. Infographics typically combine different elements such as illustrations, icons, graphs, and/or diagrams, with minimal text, to convey “bite-sized” information. They are an efficient way to present key medical and scientific data to healthcare professionals (HCPs).
Thanks to their colors and style, infographics are not only used to inform, but also to engage. This is why they are frequently used in reactive or proactive documents by medical affairs personnel during face-to-face interactions with HCPs. They are also used in medical information documents such as standard response letters (SRLs) to respond to unsolicited medical and product inquiries from HCPs. Infographics should be created in accordance with applicable legal, regulatory, and company guidelines, and must provide fair, balanced, accurate, and useful information.
The process of creating a compelling story using scientific data can be challenging, but it doesn’t have to be! At Med Communications, we create infographics that give life to your scientific content by transforming it into an insightful and visually appealing experience. Whether it is about a disease state, a drug’s mechanism of action, or methods to prevent infectious diseases, Med Communications can develop a medical infographic template that suits your need in an engaging way.
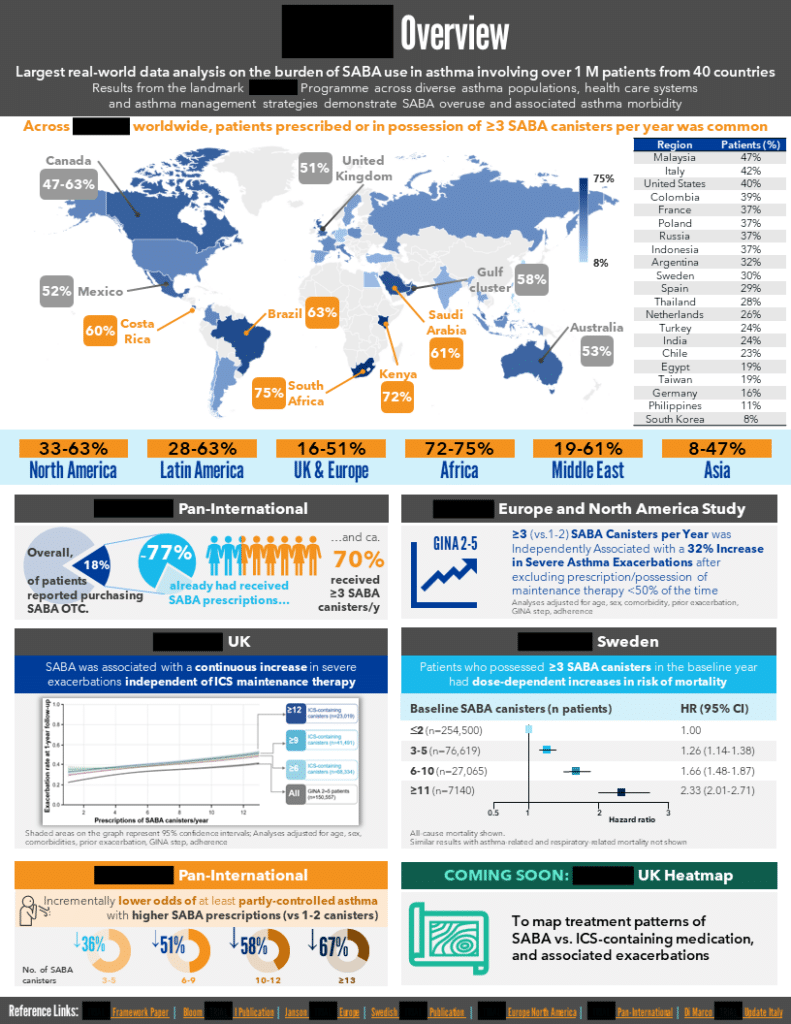
Our team of highly skilled scientific content writers and graphic illustrators work together to create quality infographics, like the redacted example below, using clinical study data and pharmaceutical product information, which can be presented within and reused across a wide variety of medical information deliverables. Depending on your specific scientific content needs, infographics can be delivered in a variety of different formats such as an image (JPEG, PNG, TIFF), Microsoft PowerPoint presentation, or an Acrobat Adobe PDF file. These diverse formats ensure that HCPs and other stakeholders can access your information via readily available software, online or offline.

There are many benefits of using infographics. Good infographics are:
- Engaging: Attention-grabbing visuals encourage readers to explore the accompanying text.
- Visually appealing: Effective application of layout, colors, and typography are the building blocks of informative, attractive infographics that are impactful and memorable.
- Clear, concise, and accessible: Infographics’ visual format helps simplify lengthy text, improving accessibility and highlighting key points at a glance.
- Time savers: Infographics serve as a powerful visual aid during discussion, highlighting important information and acting as a conversation guide.
- Effective leave-behinds: A well-designed infographic reminds the HCP of key points and references. It can also be shared with other medical staff and used as a guide during patient education.
Depending on the type of content you want to convey, you can also explore different types of infographics:
- Informational infographics present a general overview of facts and statistics about a topic, which makes them an excellent option for presenting and sharing a disease state, research outcomes, and even annual reports. This makes it one of the most popular options, even when considering promotion with infographics.
- Data visualization infographics are like informational infographics, but they focus on presenting statistics, trends, and/or comparisons. The goal is to highlight the results and impact of the data, rather than simply providing an overview.
- Process, flowchart, or timeline infographics work best for the presentation of sequential steps or events. They are a great option to explain a drug’s mechanism of action, or the drug development process to stakeholders.
- “Map” infographics adapting medical diagrams showing anatomical or histological features instead of geographical locations are also helpful in the presentation of a drug’s mechanism of action or the effects of a disease in the body.
- List infographics might be the simplest format, but they are highly effective if your goal is to simply share major key points, as one would expect when listing actions on how to help prevent a disease.
Our scientific content writers create infographics from scratch. After meeting with the client and discussing the desired infographic type, intended use, and target audience, our writers will develop the content for the infographic. They not only compile and analyze relevant medical and scientific data from the literature, but also ensure it is accurate and fair balanced by putting it through our detailed internal review process before moving forward with the graphic design process. Lastly, an additional review is conducted before final delivery to the client. Our intentionality and attention to detail ensures that we receive minimal to no corrective feedback from clients.
Infographics are a powerful tool to enhance engagement with your data, combining science, design, and communication. Partner with Med Communications to create new infographics or revamp and update your existing infographics. We will ensure that your infographics convey your unique message specifically tailored to your target audience. Contact us today to learn more: 877-477-0977 or https://medcommunications.com/contact-us/